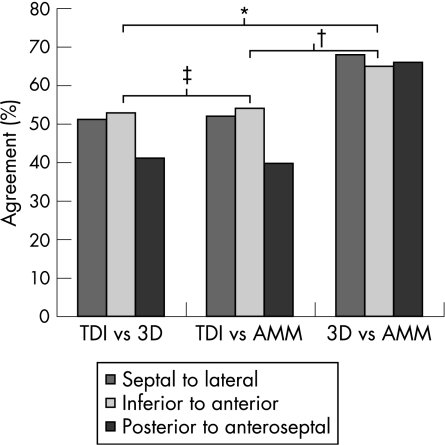
Figure 3 Percentage agreement between echocardiographic techniques in identifying walls with greater mechanical delay. Data are displayed comparing the timing of opposing walls in each of the three apical views. *χ2 = 13.6, p<0.001; †χ2 = 11.8, p = 0.001; ‡χ2 = 0.027, p = 0.869. AMM, anatomic M‐mode; 3D, three dimensional; TDI, tissue Doppler imaging.

An official website of the United States government
Here's how you know
Official websites use .gov
A
.gov website belongs to an official
government organization in the United States.
Secure .gov websites use HTTPS
A lock (
) or https:// means you've safely
connected to the .gov website. Share sensitive
information only on official, secure websites.
