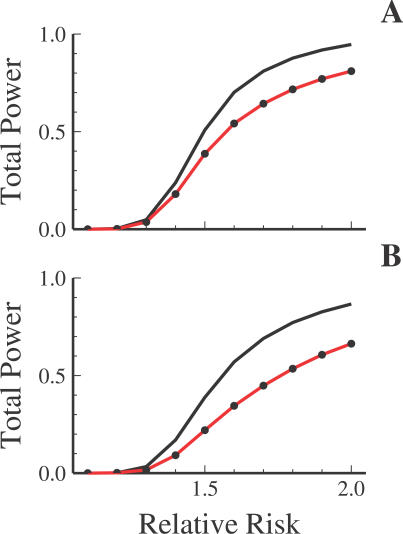
Figure 4. Total Power to Detect a Single Common Risk Allele outside of the HapMap Data Using 1,000 cases and 1,000 Controls under a Multiplicative Model.
The power is estimated using the common SNPs in 68 resequenced SeatleSNPs genes that were not characterized in the HapMap Project for (A) 23 CEU samples using HumanHap550 and (B) 24 YRI samples using HumanHap650Y. Power is calculated for a 5% false discovery rate after a Bonferroni correction for multiple testing (red line). The solid black line shows the power to detect a common risk allele in the HapMap data (i.e., solid red lines in Figure 2).

