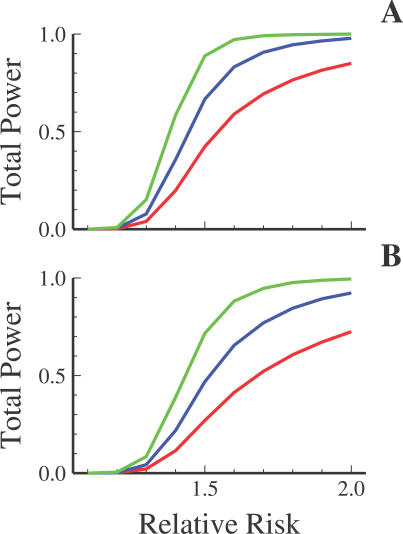
Figure 5. Power to Detect At Least One Risk Allele in CEU (HumanHap550) and YRI (HumanHap650Y) in 1,000 Cases and 1,000 Controls under a Multiplicative Model.
Curves represent the cases where there is a single risk locus (red), two independent loci (blue), or four independent loci (green). The red lines are the single risk loci as shown in Figure 4. Under the multiple loci cases, the relative risk represents the minimum risk for all risk alleles and the corresponding power represents a lower bound on the power.

