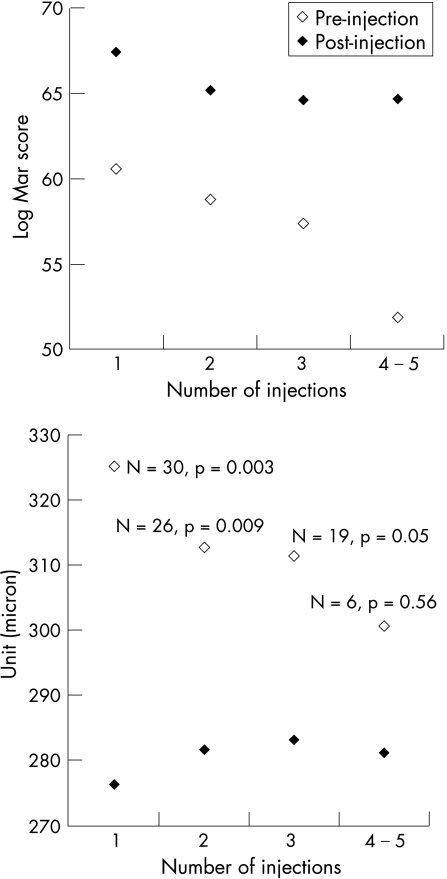
Figure 1 Mean visual acuity (top) and macular thickness (bottom) immediately prior to IVTA injection compared with the best post‐injection values within 6 months after each injection. Data are grouped according to number of injection, irrespective of how many injections each eye received during the study.

An official website of the United States government
Here's how you know
Official websites use .gov
A
.gov website belongs to an official
government organization in the United States.
Secure .gov websites use HTTPS
A lock (
) or https:// means you've safely
connected to the .gov website. Share sensitive
information only on official, secure websites.
