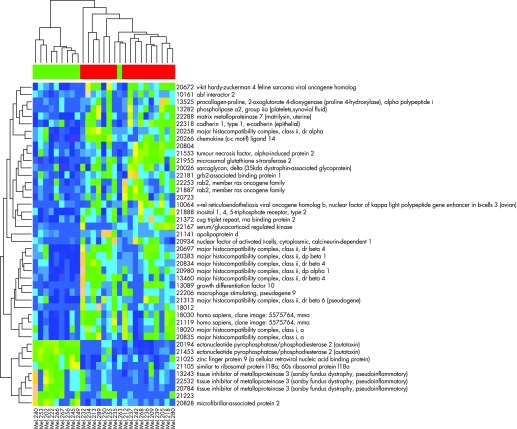
Figure 5 Gene profiles of the 44 key genes across the 27 samples with the dendrogram from the samples on the top and the dendrogram from the 44 key genes on the side. Pink indicates the high expression and cerulean blue indicates low expression. The colour bar on the top indicates the metastatic death status—green for alive and red for dead. The 44 key genes are clustered into two major groups shown in the site dendrogram: one group has high expressions in molecular class 1 and low expressions in molecular class 2 and the other low in molecular class 1 and high in molecular class 2.

An official website of the United States government
Here's how you know
Official websites use .gov
A
.gov website belongs to an official
government organization in the United States.
Secure .gov websites use HTTPS
A lock (
) or https:// means you've safely
connected to the .gov website. Share sensitive
information only on official, secure websites.
