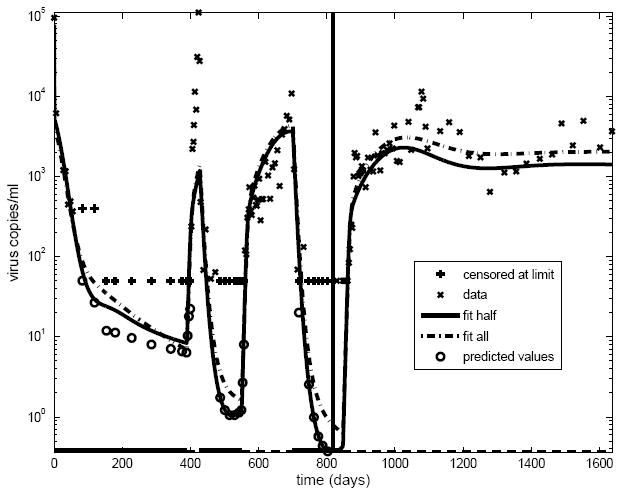
Fig 2.

Longitudinal data on viral load measurements from a single patient acutely infected with HIV, with fitted time profiles obtained from a model similar to that depicted schematically in Fig. 1 superimposed. The “x” symbols indicate viral load measurements above the limit of quantification of the assay. The “+” symbols indicate that a viral load measurement at that time point is known only to lie below the limit of quantification of the assay used at that time point; in this case, symbols are plotted at the limit of quantification. The thick bars on the horizontal time axis correspond to time intervals when the patient was on antiretroviral therapy; note that this patient permanently interrupted therapy at about 825 days. The dashed line shows the fit using all the data for the entire 1600 days. The solid line shows another fit using only the data up to the time of permanent treatment interruption. The fit of the model takes into account the “censoring” of viral loads at the limit of quantification, with the open circles representing “predicted values” of viral loads known only to be below the limit.
