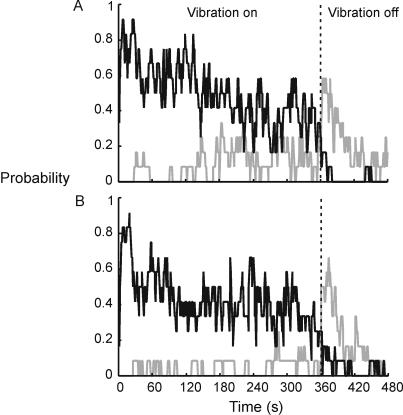
Figure 2. Probability of responding as a function of time recorded with 1-second precision (N = 12).
Black line indicates probability of perceived elbow extension (Pext) and the grey line, of flexion (Pflex). Participants had the option of not pressing either key (‘silence’), in the absence of a clear feeling of movement. Thus, for any given second, Pext+Pflex+Psilence = 1. A. Results from Run 1. B. Results from Run 2.

