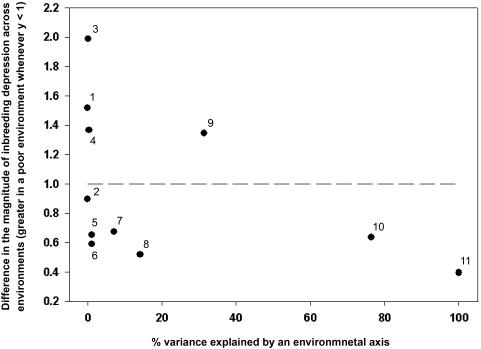
Figure 2. Difference in the magnitude of inbreeding depression in recruitment across environmental axes in the great tit.
The difference in the magnitude of inbreeding depression is here defined as the difference in inbreeding depression between good and bad environments; each data point refers to one environmental axis. For all cases where y<1, the point estimate for inbreeding depression was larger in the poor environment relative to the good one. Where y>1, inbreeding depression was less severe in a bad environment than in a good environment. The numbering of each data point refers to the numbering in table 1 and represents the following environmental axes: (1) yearly population density of breeding events, (2) local oak density, (3) female parental age, (4) male parental age, (5) local population density of breeding events, (6) nestbox distance from forest edge, (7) lag between caterpillar peak and hatching peak, (8) fledging mass, (9) winter beech mast abundance, (10) phenotypic coefficient of variation in recruitment, and (11) yearly quality in recruitment.

