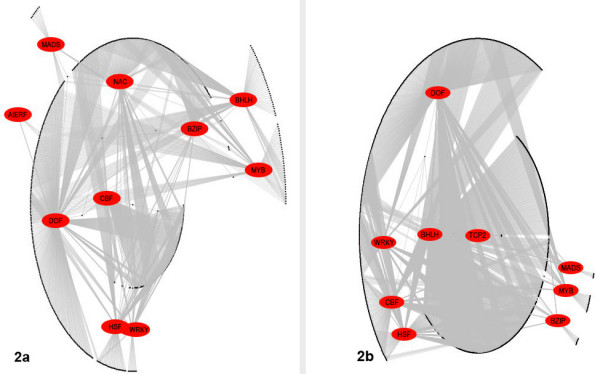
Figure 2.

Large scale regulatory network. Overview of the regulatory network. 2a. Up-regulated gene network. 2b. Down-regulated gene network. The entries in red ovals represent the TFs and the black dots represent target genes. The networks were generated using Graphviz version 1.13–16 [65].
