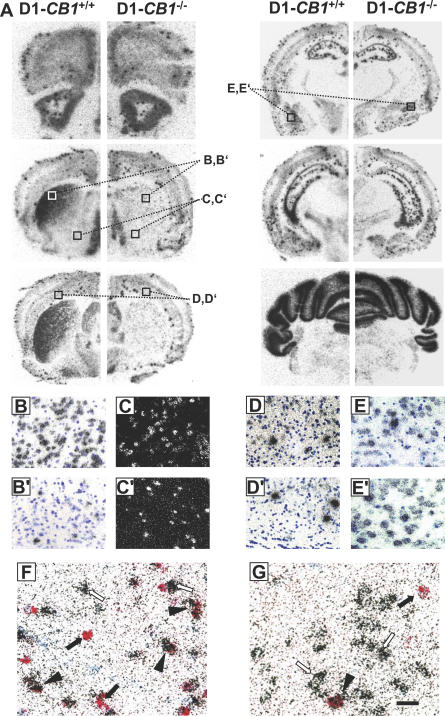
Figure 2. CB1 Receptor mRNA Distribution in D1-CB1 −/− Mice.
(A) Bright-field photomicrographs showing CB1 mRNA expression in coronal brain sections of wild-type D1-CB1 +/+ (left panels) and D1-CB1 −/− mice (right panels).
(B–E′) Micrograph showing high magnifications of the details indicated in (A). (B and B′) Detail (corresponding to the areas depicted in (A)) of CB1 expression in the dorsolateral caudate putamen of D1-CB1 +/+ (B) and D1-CB1 −/− (B′). Note the strong decrease in CB1-expressing cells in mutant mice.
(C and C′) Dark-field micrographs showing detail (corresponding to the areas depicted in (A)) of CB1 mRNA expression in the ventral striatum of D1-CB1 +/+ (C) and D1-CB1 −/− (C′).
(D andD′) Bright-field micrographs showing the expression of CB1 mRNA in layer VI of neocortex (corresponding to the areas depicted in (A)). Note the similar number of cells expressing CB1 at high levels (intense concentration of silver grains) between genotypes and the decreased amount of cells expressing CB1 at low levels in D1-CB1 −/− mice (see text for quantifications and details).
(E and E′) No evident difference in the levels of CB1 expression were observed in any other cortical regions, as exemplified in the basolateral amygdala.
(F and G) Micrographs showing CB1 mRNA (red staining) together with dopamine receptor D2 (silver grains) in the dorsal striatum of D1-CB1 +/+ (F) and D1-CB1 −/− mice (G). Note the reduction of CB1-expressing neurons and the presence of both dopamine receptor D2-positive and D2-negative CB1-containing cells in D1-CB1 −/− mice (see text for quantifications and details). Filled arrows, single CB1-expressing neurons; open arrows, single D2-expressing neurons; filled arrowheads, double CB1/D2 expressing neurons. Blue staining, toluidine blue nuclear counterstaining. Bars, 30 μm in B–E′, 15 μm in F and G.

