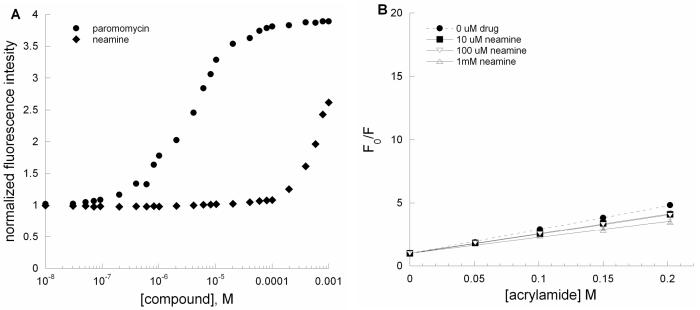
Figure 5.
(A) Plots of normalized fluorescence at 370 nm versus [compound] for AS RNA (•, paromomycin; ◆, neamine) of A-site RNA (AS) upon binding to paromomycin and neamine. (B) Stern-Volmer plots for F0/F versus [acrylamide] for AS RNA in the presence of neamine (•, □, ▽, and △; 0, 10, 100 and 1000 μM, respectively). The Ksv values are given in Table 1.

