
Figure 2.
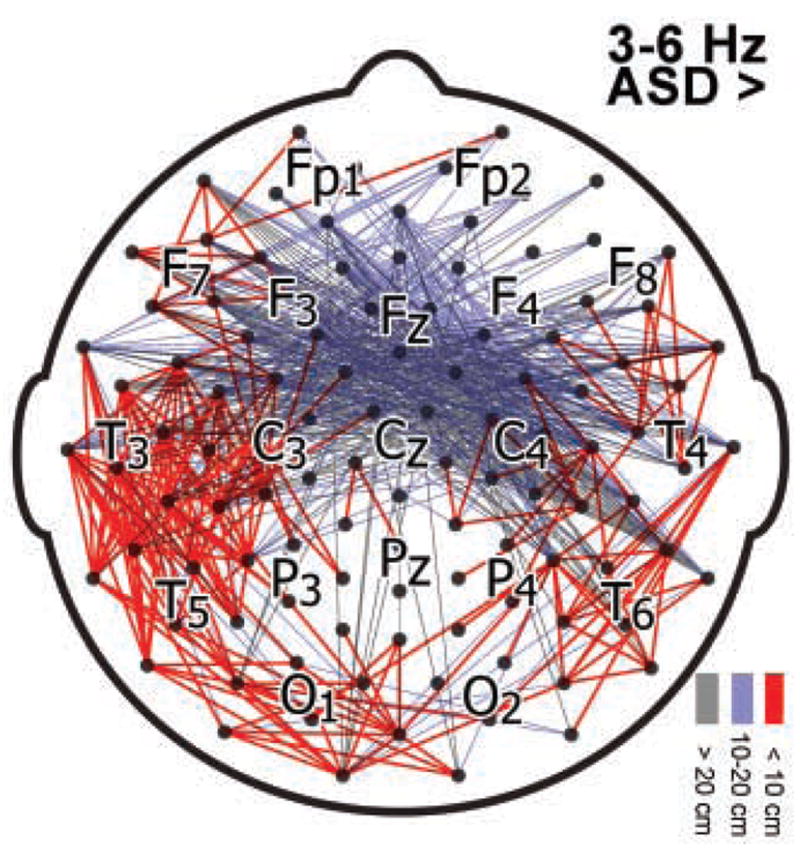
Topography of significantly elevated ASD group coherences in the 3–6 Hz band. Lines are drawn between channel pairs at which ASD group coherence exceeded control with p-values below .025. Lines are colored according to distance (cm) between electrode pairs, along the scalp surface.