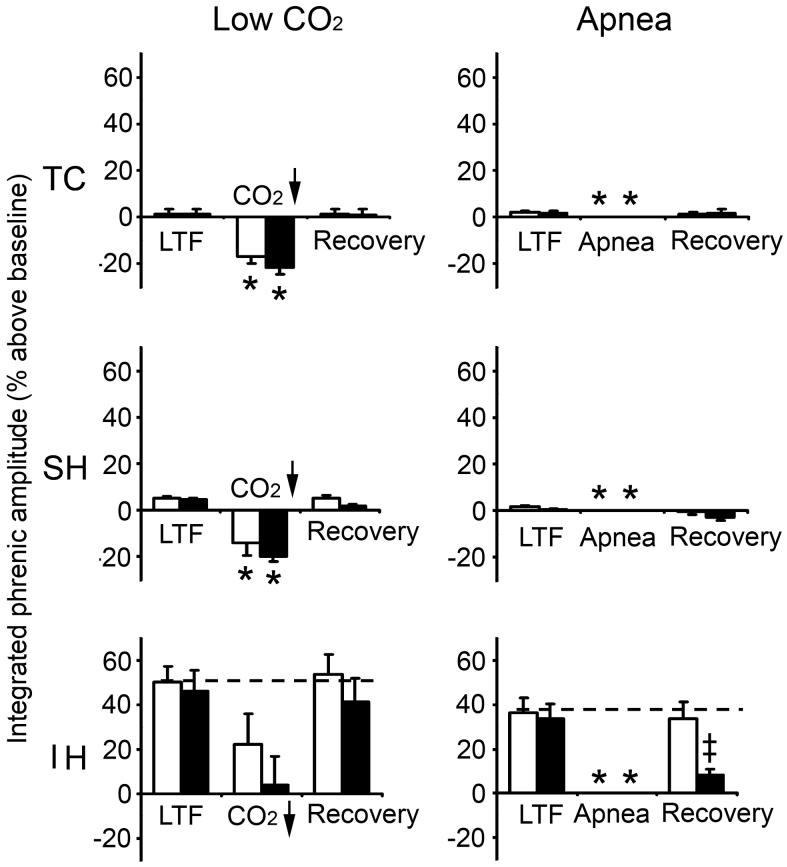
Fig. 2.
Phrenic LTF at 60 min post-hypoxia in TC, SH and IH groups before, during and after hypocapnic test without PEEP (white column) or with PEEP (black column). Left panel: Effect of low CO2 (5 torr below control) on LTF, n=4 for all groups except IH with PEEP (n=5). Right panel: Effect of apnea on LTF. n=4 for all groups except IH (n=7). Data (means ± SE) expressed as percentage above baseline. The apnea data (-100% below baseline) are not plotted. * indicates significant difference from baseline; ‡ indicates significant difference from non-PEEP and LTF.

