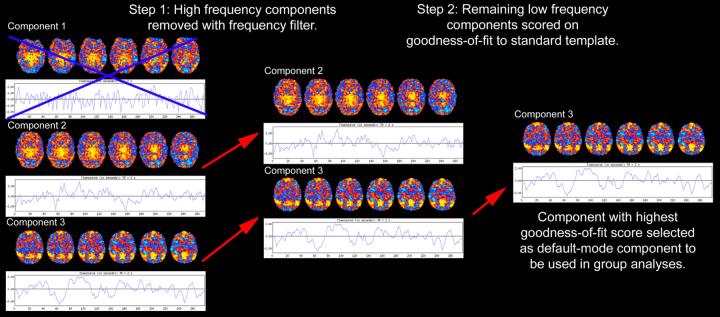
Figure 1. Automated selection of the default-mode component.
Each subject's default-mode component is selected from among their 25 components based on the two-step process outlined above (shown here with only 3 components). Each component consists of a spatial map (colored axial images) and its corresponding timeseries shown beneath it. The color scale indicates the degree to which a given voxel's timeseries is correlated with the overall timeseries of that component (with yellow-red colors indicating a positive correlation and blue colors indicating a negative correlation). Firstly, because resting-state neural networks are driven by low-frequency oscillations, all high-frequency components (component 1 in this example) are removed using a frequency filter. The remaining low-frequency components are scored based on their spatial goodness-of-fit to a standard template of the default-mode network derived from a separate dataset (template not shown). The component with the highest goodness-of-fit score (component 3 here) is then entered into the group analyses. Note that all voxels of the selected component have z-scores, not just those voxels that fall within the regions defined by the standard template.

