
Figure 2. Increased default-mode network functional connectivity in subjects with major depression.
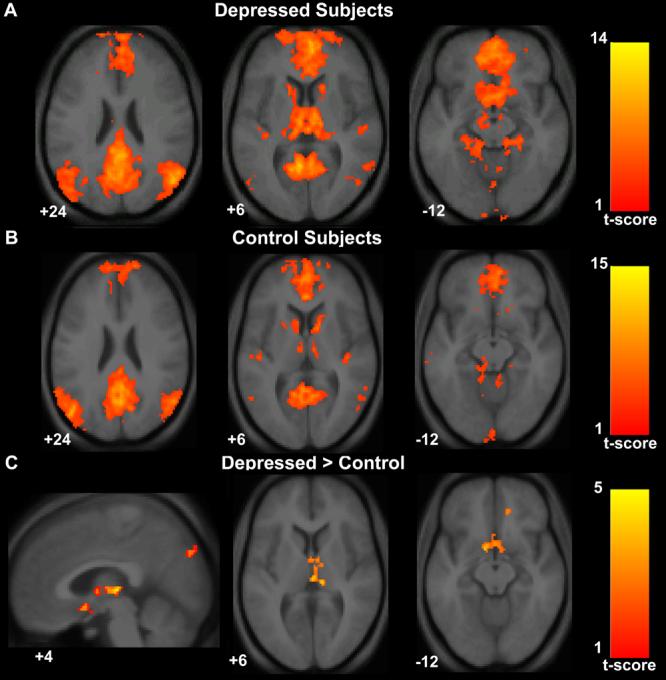
Axial images of group default-mode functional connectivity in depressed subjects (A) and in healthy controls (B). The contrast map in (C) demonstrates clusters in the subgenual cingulate, thalamus, and precuneus where resting-state functional connectivity was greater in depressed subjects versus controls. T-score bars are shown at right. Note that while the color scale range begins at 1, the minimum t-value for the analyses were 3.42 for the depressed group map (A), 3.58 for the control group map (B), and 2.41 for the depressed versus control contrast map (C). Numbers at the bottom left of the images refer to the z-coordinates (and for the sagittal image the x-coordinates) in the standard space of the Montreal Neurological Institute (MNI) template. The left side of the image corresponds to the left side of the brain.