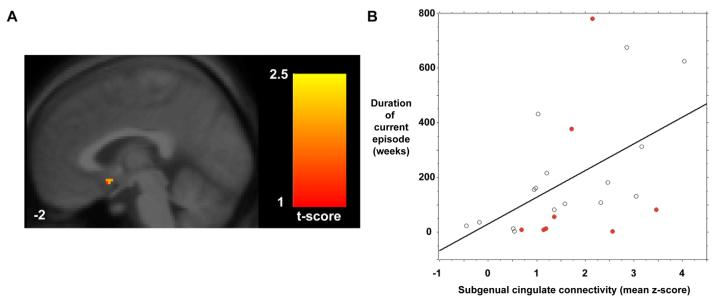
Figure 3. Subgenual cingulate functional connectivity in the default-mode network correlates with duration of the current depressive episode.
A sagittal image (A) shows the subgenual cingulate cluster whose resting-state functional connectivity correlated with the duration of the current depressive episode across 24 depressed subjects. The same finding is represented graphically (B) in a scattergram of duration in weeks against the mean z-score within the subgenual cluster shown in (A). The pearson correlation coefficient was 0.49 (Fisher's r to z, p = 0.014). Red circles indicate the 8 depressed subjects who were unmedicated.

