
Figure 2.
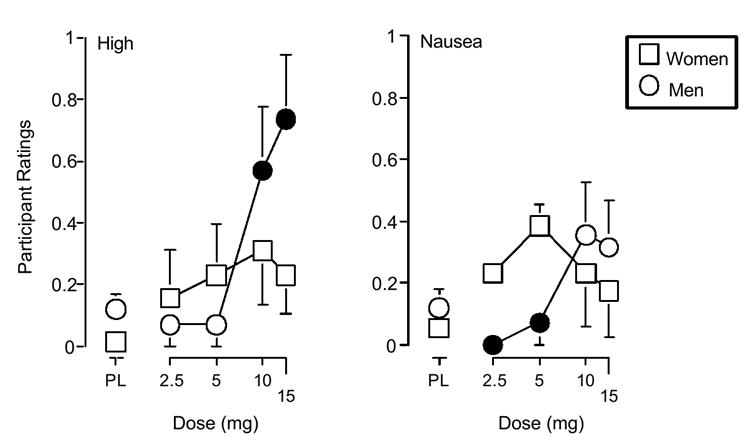
Effects of d-amphetamine dose and sex on ratings of high and nausea from the drug effect questionnaire. Filled symbols indicate those values that are significantly different from the corresponding value (p ≤ 0.05, Fisher’s [PLSD] post hoc test). All other details are as in figure 1.