
Figure 1.
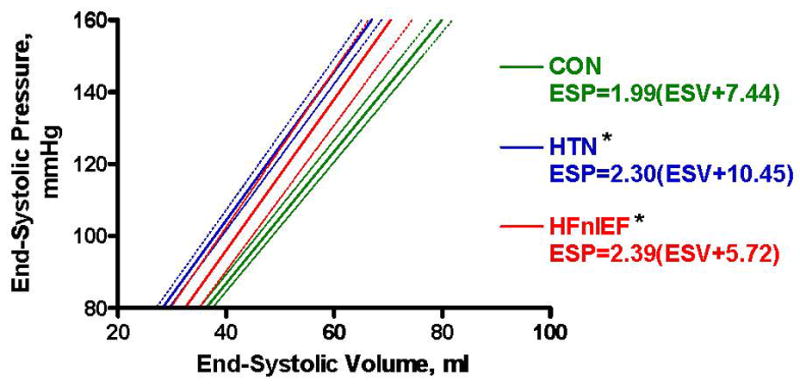
Schematic of group-averaged end-systolic pressure-volume relationship (ESPVR), where ESP = Ees(ESV-V0) (Ees = end-systolic elastance; V0 = volume intercept). Solid lines represent the mean ESPVR and dotted lines the 95% confidence intervals for each group. For comparison of Ees (slope) between groups, *p<0.05 vs CON.