
Figure 3.
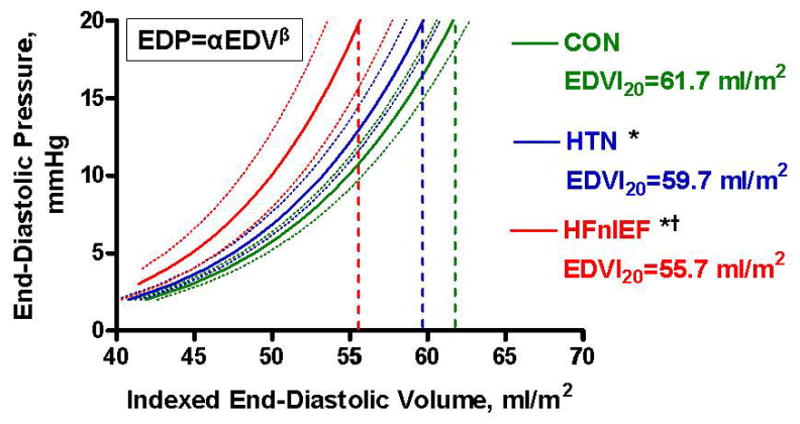
Schematic of group-averaged end-diastolic pressure-volume relationship (EDPVR), where EDP = αEDVβ (α = curve fitting constant; β = diastolic stiffness constant). Solid lines represent the mean EDPVR and dotted lines the 95% confidence intervals for each group. For comparison of indexed EDV at a common EDP of 20 mmHg (EDVI20) between groups, *p<0.05 vs CON; † p<0.05 vs HTN.