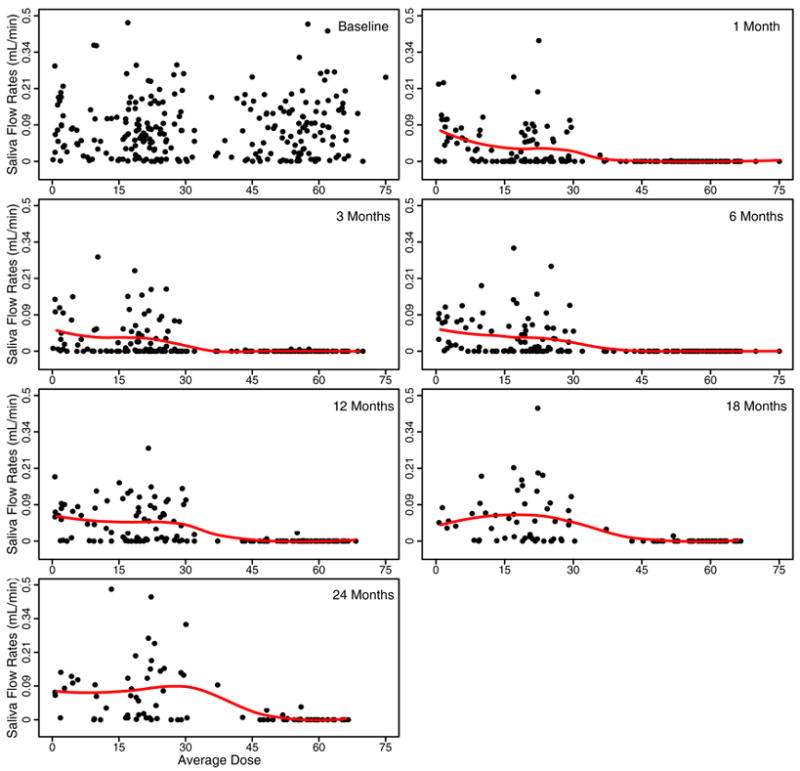
Figure 2.

Unstimulated saliva flow rates versus mean radiation dose at baseline and 1, 3, 6, 12, 18, 24 months after the completion of RT. The flow rates are plotted on a log(flow rates + 1) transformed scale for each gland. The solid line is the LOESS smoothing line describing the relationship between flow rates and mean doses.
