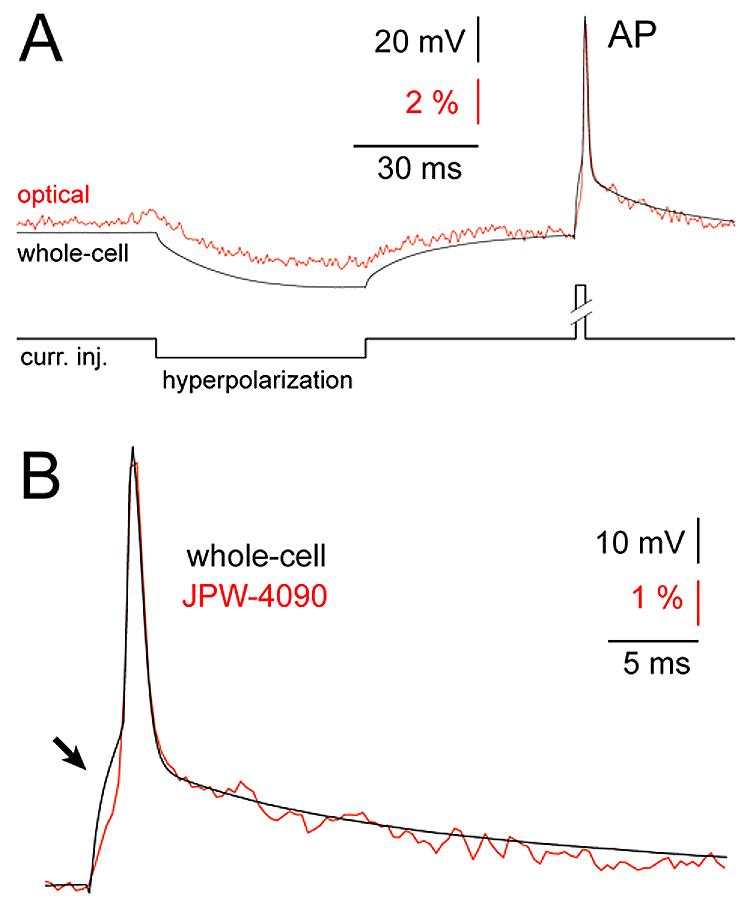
Fig. 2. Fast response time of blue voltage-sensitive dyes.

(A) Simultaneous whole-cell (black) and optical (red) recordings of the evoked membrane potential changes using blue dye JPW-4090. Optical signal was sampled from the basal dendrite 45 μm away from the cell body. Average of 6 sweeps. (B) A segment of trace containing AP is blown up to show temporal correlation between whole-cell (black) and optical signal (red). A distortion in electrical recording caused by poorly compensated series resistance (arrow) does not appear in the optical signal.
