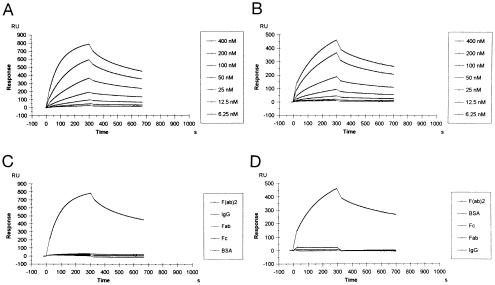
Figure 4.
Comparison of BIAcore sensorgrams for the interaction between recombinant antibody fragments and immobilized antigens. Overlap plots showing interaction of scFv2 (A) and scFv6 (B) with immobilized F(ab′)2 at different scFv concentrations. Interaction of scFv2 (C) and scFv6 (D) at 400 nM with different antigens. The association and dissociation phases of the sensorgrams are shown. The bulk effect is subtracted from the relative response. Legends in the right of each plot show the list of scFv concentrations (A and B) or immobilized antigens (C and D) in the order of decreasing resonance signals. RU, response units.

