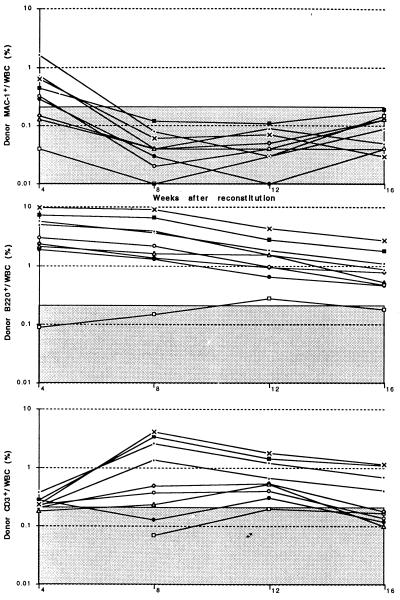
Figure 2.
Donor myeloid, B, and T lineage reconstitution profiles of 9 mice injected with 50 donor-type Thy-1.1loSca-1+Lin−Mac-1loCD4− cells (purified from the spleens of donor mice on day 7 of CY/G-CSF treatment) plus 200,000 recipient-type WBM cells. Each line represents a separate mouse, and the shaded area represents the range of background signals based on negative control mice reconstituted only with recipient-type WBM cells. Donor cells are presented as a percentage of all white blood cells.

