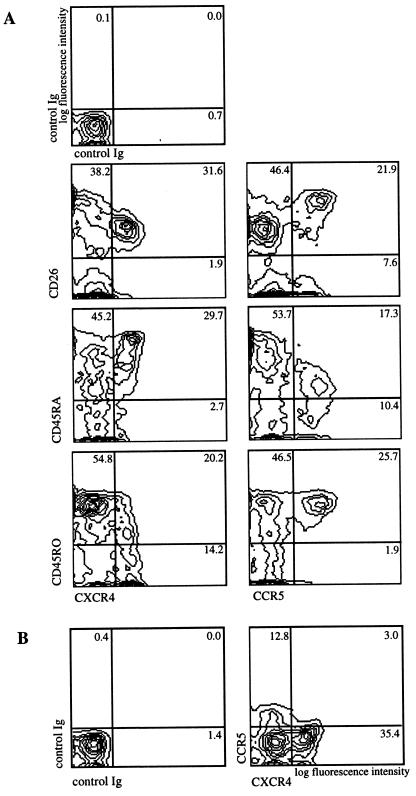
Figure 2.
The HIV coreceptors CXCR4 and CCR5 are expressed on distinct T lymphocyte subsets. (A) Three-color flow cytometry of freshly isolated PBMC shows expression on distinct T lymphocyte subsets. Two-dimensional contour plots show CXCR4 (12G5 mAb) and CCR5 (5C7 mAb) expression versus CD26, CD45RA, and CD45R0. (Top Left) Staining using irrelevant control antibodies. Lymphocytes were gated according to their forward and side scatter, and CD3-PerCP staining. (B) Two-dimensional contour plot shows expression of CXCR4 (12G5 mAb) versus CCR5 (biotinylated 3D8 mAb) on T cells. T cells were analyzed as in A. Percentages of cells in the respective quadrants are indicated.

