Figure 3.
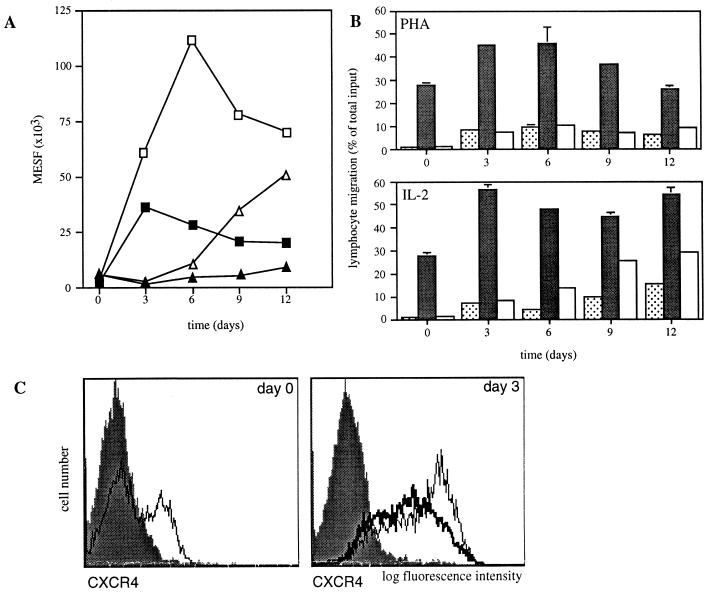
CXCR4 and CCR5 are differentially regulated during PHA stimulation and IL-2 priming. (A) Expression of CXCR4 (squares) and CCR5 (triangles) changes during PHA stimulation (filled symbols) and IL-2 priming (open symbols). Immunofluorescent staining with 12G5 mAb to CXCR4 and 5C7 mAb to CCR5 is expressed for the entire population as number of molecules of equivalent soluble fluorochrome (MESF) from one representative experiment of three. Fluorescent intensity of the entire population for CCR5 decreased on day 3 as the CCR5-positive subset of T cells was markedly reduced. T cells were gated according to their forward and side scatter, and CD3-PerCP staining in A and C. (B) Chemotactic response to SDF-1 and MIP-1β correlates with expression of CXCR4 and CCR5, respectively. T cells migrated to control medium (dotted columns), SDF-1α-(1–67) (1.5 μg/ml) (filled columns), and MIP-1β (100 ng/ml) (open columns). Shown is chemotaxis of PBMC stimulated with PHA (Upper) or primed with IL-2 (Lower) for the indicated number of days. Bars indicate the range of duplicates. (C) CXCR4 is rapidly up-regulated during PHA stimulation and IL-2 priming. CXCR4 expression was measured in freshly isolated lymphocytes (thin line, Left), in day 3 PHA-stimulated T cell blast (thick line, Right), and in day 3 IL-2 stimulated T cells (thin line, Right). The filled bar graphs indicate staining with an unrelated control mAb.

