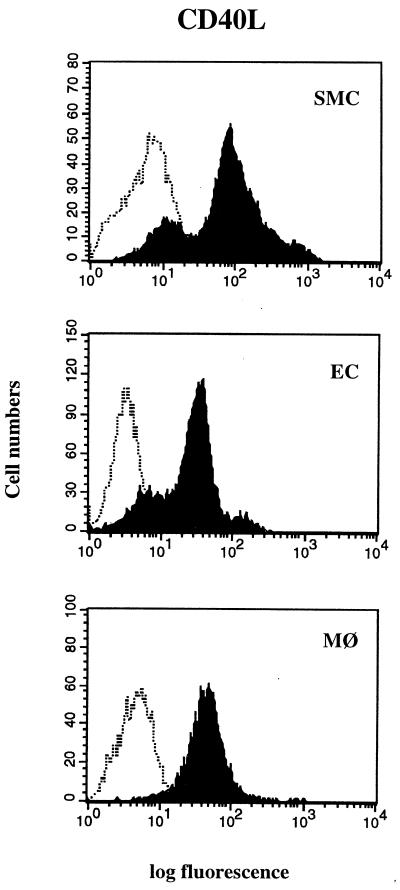
Figure 2.
FACS analysis of human vascular SMC, EC, and human macrophages (MØ) cultured in serum-containing medium, stained for CD40L (solid histograms), as well as isotype control (open histograms) are shown. Each panel is a histogram representing cell numbers (y axis) vs. log fluorescence intensity (x axis) for 30,000 viable cells. Results shown were reproduced in three independent experiments.

