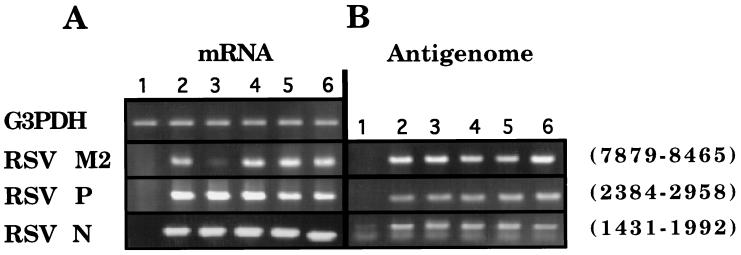
Figure 4.
RT-PCR analysis reveals a selective decrease in the levels of the targeted viral M2 mRNA. RT-PCR analysis of mRNAs (A) and the antigenomic (+) strand of RSV RNA (B) is shown. RNA was analyzed from either uninfected cells (lane 1) or RSV-infected 9HTE cells (lanes 2–6). Single doses of oligonucleotides (3.3 μM) added at 2 h postinfection were as follows: lane 3, spA4-antiRSV3′-3′T/(8281–8299); lane 4, spA2-antiRSV3′-3′T/(8281–8299); lane 5, spA4-scramble3′-3′T/(8281–8299); and lane 6, antiRSV(P-S)/(8281–8299). RNA samples were collected at 8 h postinfection for RT reactions, which were primed with either oligo(dT) (for analysis of mRNAs) or with an oligonucleotide complementary to a sequence in the RSV L gene for the (+) antigenomic strand (see Table 2). The RSV bases that were amplified are indicated to the right. An image of the ethidium bromide-stained gel is shown. G3PDH, cellular glyceraldehyde-3-phosphate dehydrogenase mRNA.

