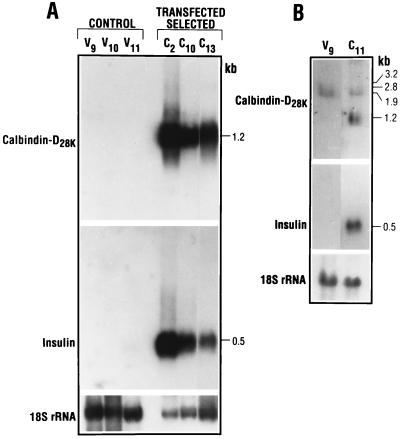
Figure 2.
Northern blot analysis of RIN cell mRNA. (A) Northern analysis of vector-transfected clones, V9, V10, and V11, and calbindin-D28k-transfected clones, C2, C10, and C13. (B) Northern blot analysis of vector-transfected clone V9 and calbindin-D28k-transfected clone C11. With longer exposure, endogenous calbindin-D28k mRNA (1.9 kb) is observed. This mRNA can be distinguished from that of the transfected DNA transcript, which is a shorter mRNA (1.2 kb) because it lacks the 5′ and 3′ untranslated regions. Longer autoradiographic exposure was needed to observe calbindin and insulin mRNA in vector-transfected cells. Thus, the exact induction in most of the calbindin-overexpressing clones was difficult to quantify because mRNA levels were beyond the linear range of film sensitivity. However, it was noted that levels of calbindin and insulin mRNA in C2, C10, and C13 were increased >30-fold compared with levels in vector-transfected cells. Levels of calbindin mRNA were induced 5.5 ± 1-fold, and levels of insulin mRNA were induced 14-fold to >20-fold in clone C11. Results shown are representative of 4–10 separate experiments. Radiographic exposure time for the results shown: calbindin-D28k mRNA (A, 1 day; B, 5 days); insulin mRNA (A, 16 h; B, 3 days).

