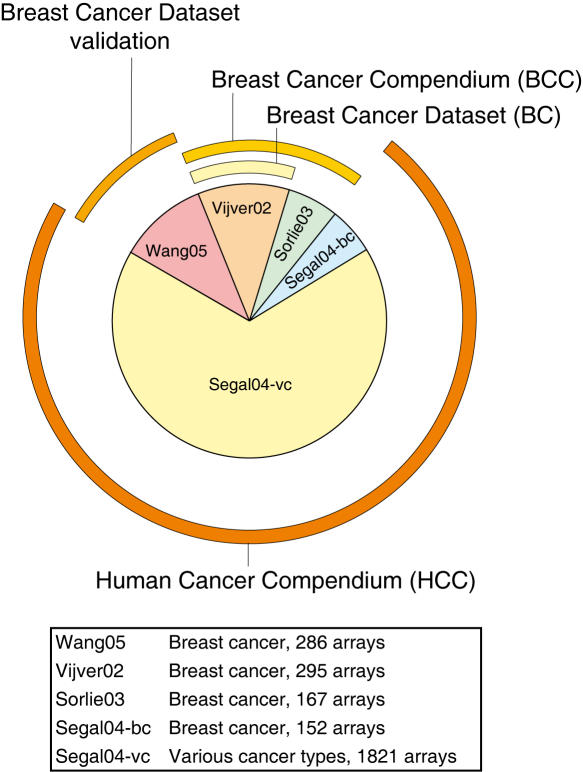
Figure 2. Compendia of microarray data.
Microarray datasets can be grouped into compendia at various levels of underlying phenotypic diversity. The pie-chart indicates datasets from various origins, sizes, and cancer types, and the compendia are indicated by the outer rings. The ’Inter1’ training-validation configuration is depicted in this figure ([4] as training, and [3] as validation). This is one of the six configurations employed (See Table 1 for details).

