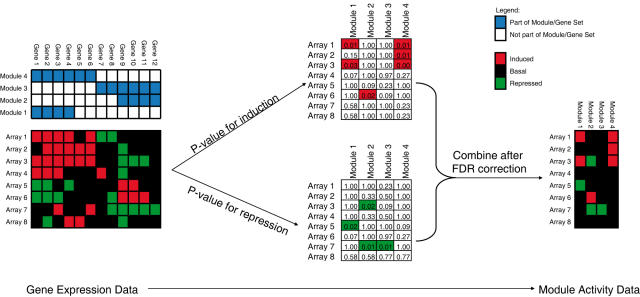
Figure 4. Converting gene expression data into module activity data.
For a given gene expression dataset, and a set of modules we assessed the statistical significance of the overlap of induced/repressed genes with the modules using the hypergeometric distribution. This leads to two p-values for each array/module pair. These p-values are combined into a single discrete module activity score.

