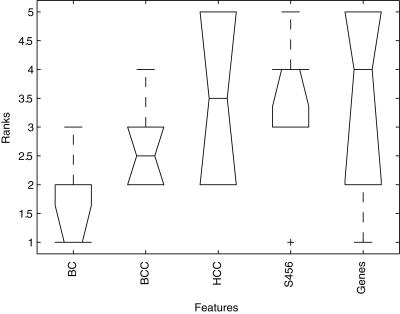
Figure 5. Boxplot showing ranked AUC results.
Boxplot showing the median ranks of the performance of each of the five feature types across the six experiments (see Table 1). In each of the six experiments the features were ranked based on the AUC obtained on the independent validation set (1 best, 5 worst).

