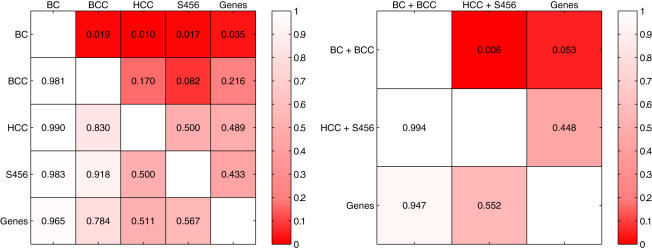
Figure 6. Pairwise comparison of the five feature types.
Each cell (row = i, column = j) depicts the the p-value obtained by performing a one-sided Wilcoxon rank sum test with as alternative hypothesis that the median rank of type i is lower than type j, based on the AUCs achieved for each of the six experiments. The plot on the left shows individual comparisons, the plot on the right includes comparisons of groups of features. Cell-shading reflects the p-values.

