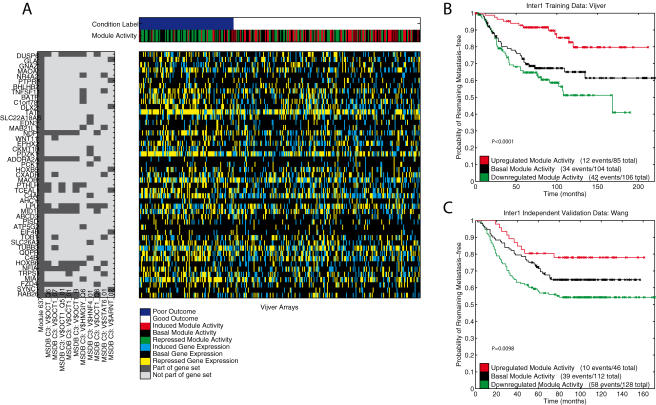
Figure 9. An Oct1 related module.
A) Module activity data of an OCT1 transcription factor related module (Module group 4 in Figure 7) that was extracted from the Vijver [21] data (Inter1, Table 1). The top heatmap shows the binary condition label, and the discrete module activity data (rows), for all the Vijver arrays (columns) [4]. Arrays are ordered according to the metastasis free survival time. The heatmap in the middle shows the discrete gene expression data for the 47 genes (rows) in the module. On the left, a binary heatmap shows the 47 genes, along with the gene sets that show the most significant overlap with this module. The gene sets are ranked based on their p-value for the overlap with the module (hypergeometric distribution), we show the top 10 gene sets (p-values ranging from 10−13 to 10−7, all significant at p<0.05 after Bonferroni correction). On the right, two Kaplan-Meier curves indicate the predictive power of this module when arrays with the same module activity are grouped. B) The Kaplan-Meier curves for the three groups defined by the activity of this module on the Vijver [21] data (Inter1 training, Table 1). C) The Kaplan-Meier curves for the three groups defined by the activity of this module on the independent [3] data (Inter1 test data, Table 1). The legend indicates the three groups and lists the number of events and total number within the groups. P-values correspond to the logrank test.

