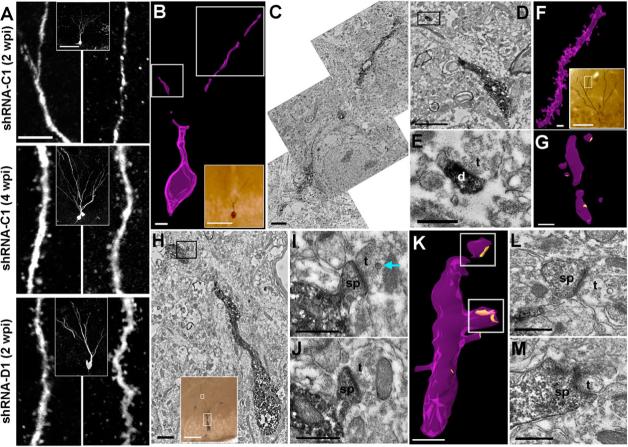
Figure 6. Formation of dendritic spines and synapses in adult-born neurons.
(A) Sample confocal images of shRNA-C1/GFP+ neurons at 2, 4 wpi and an shRNA-D1/GFP+ neuron at 2 wpi. Shown are projections of Z-series confocal images at high magnification to reveal dendritic spine structures. Scale bar: 5 μm. Insets show projection views of GFP+ neurons. Scale bar: 20 μm. (B-G) Electron microscopy analysis of formation of dendritic spines and synapses in normal new granule cells. Shown in (B) is a 3D reconstruction of serial sections through dendrites and soma of an shRNA-C1/GFP+ neuron at 2 wpi (a light micrograph view in the inset, scale bar: 50 μm). Scale bar: 5 μm. The regions within the right and left white boxes in (B) are shown at a higher magnification in (C) and (D), respectively. Scale bar: 2 μm. The boxed region in (D) is shown at a higher magnification in (E) and is an example of a synapse formed onto the dendritic shaft of this neuron. Scale bar: 0.5 μm. “d”: dendrite; “t”: terminal. Shown in (F) is a 3D reconstruction of serial sections through dendrites of an shRNA-C1/GFP+ neuron at 4 wpi (a light micrograph view in the inset). Scale bar: 50 μm. Yellow regions shown in (G) indicate postsynaptic densities identified by EM. Scale bar: 1 μm. (H-M) Presence of dendritic spines and synapses in new neurons with DISC1 knockdown at 2 wpi. Shown in (H) is an electron micrograph of a dendrite of an shRNA-D1/GFP+ neuron at 2wpi (large boxed region in the inset, scale bar: 50 μm). Scale bar: 1 μm. The boxed region in (H) is shown at higher magnification in (I) and (J), which are serial sections through a dendritic spine with an asymmetric synapse containing a dense core vesicle in the axonal terminal (arrows). Scale bars: 0.5 μm. Shown in (K) is a 3D reconstruction of serial sections through a more distal segment of dendrites from the same neuron (the small boxed region within the inset of H). Scale bar: 1 μm. Shown in (L) and (M) are higher magnification images of the synapses found on the dendritic segment within the top and bottom white boxes in (K), respectively. Scale bar: 0.5 μm. “sp”: spine.

