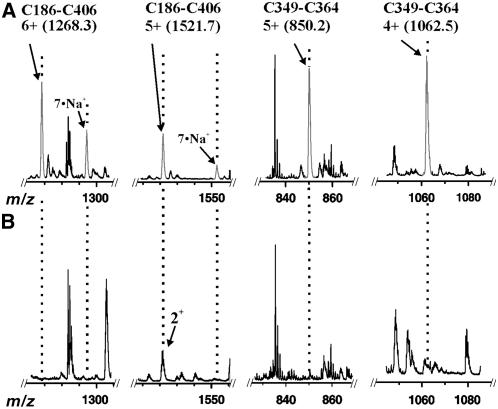
Figure 3.
Comparison of Unreduced versus Reduced At GCL.
(A) ESI-Q-TOF mass spectrum of an unfractionated tryptic digestion highlighting various regions of the m/z range displaying charge states of the disulfide-linked dipeptides.
(B) ESI-Q-TOF mass spectrum of a reduced, unfractionated tryptic digestion highlighting the disappearance of the dipeptide species (gray) visible in (A).

