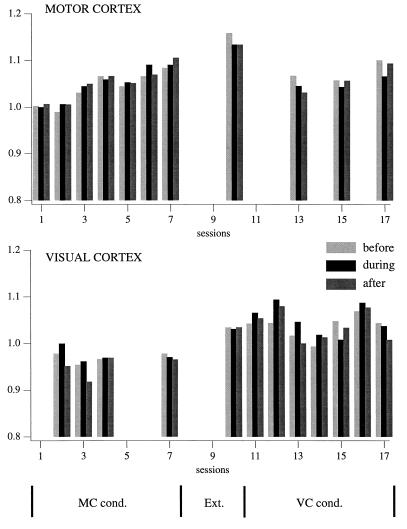
Figure 4.
Evolution of the power spectrum of motor and visual cortex EEGs, used alternatively as criterion leads. Each bar represents the averaged fast Fourier transform area between 20 and 50 Hz from a 2-s window extracted from each of the 200 trials of a conditioning session. The 2-s windows were chosen as follows: light gray (before), before the onset of the LED flash; black (during), immediately after LED onset; and dark gray (after), from the next 2 s. The calculated values were normalized by dividing them with the during-value of the first day. Note local increase (<10%) of the activation in motor and visual cortex during their respective conditioning procedures. The motor cortex reaches its maximum activation during the extinction period (session 10).

