
Figure 6.
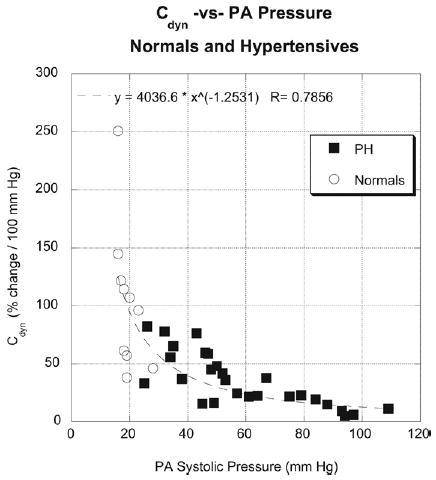
Dynamic compliance (Cdyn) plotted against pulmonary artery (PA) systolic pressure for both control subjects (circles) and patients with pulmonary hypertension (squares). Note nonlinear relationship, indicating mechanical response of PAs to pressure.