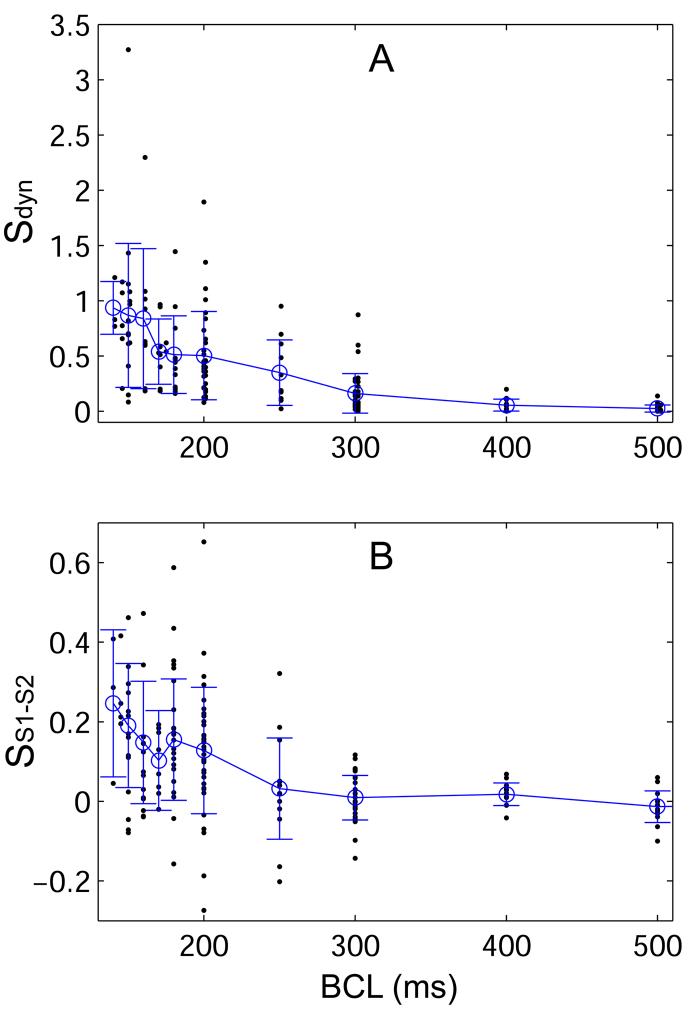
Figure 4.
Slopes of the (A) dynamic (Sdyn) and (B) S1-S2 (SS1-S2) RCs as a function of BCL from all animals. Dots represent individual slope values, open circles indicate the overall mean slope at a given BCL, and error bars indicate the standard deviation of values at each BCL. The mean slope of the dynamic RC approaches one at the shortest BCL. The mean S1-S2 slope remains well below one at all BCL, and the maximum observed slope is less than 0.7.

