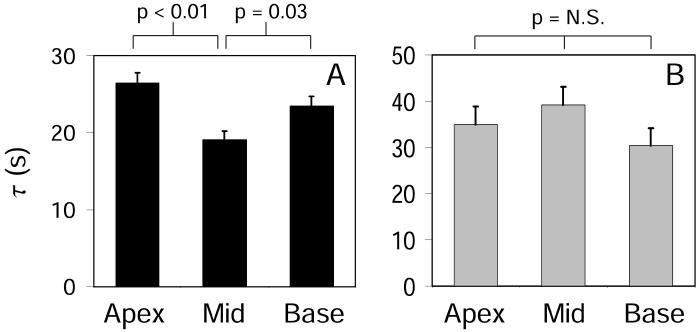
Figure 7.
Mean time constants of short-term memory in response to large step-changes in BCL. Time constants are shown by recording site. In A, the response was measured close to the pacing site using the experimental design shown in Figure 2A. Mean data from five animals is shown. The time constant was significantly shorter at the mid-ventricle (τ = 19.1 ± 1.1 s) than at the apex (τ = 26.5 ± 1.3 s) or base (τ = 23.5 ± 1.2 s). In B, the distance between recording and pacing sites ranged from a few mm to several cm, as shown in the experimental design in Figure 2B. Mean data from five animals is shown. There were no significant differences in τ among recording sites.

