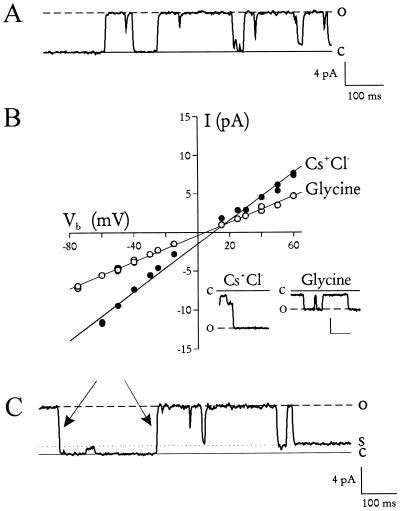
Figure 1.
Incorporation of the nutrient channel into planar lipid bilayers. (A) Channel activity seen after addition of parasite vesicles to planar lipid bilayers. Dashed and solid lines represent channel open and closed states, respectively. Bathing solution was designed to simulate RBC cytosol and contained (both sides) 100 mM KCl with buffer A (20 mM Hepes/2.0 mM MgCl2/1 mM Na2ATP, pH 7.3 with NaOH). Vb was +30 mV. (B) The channel’s current–voltage relationship. Main figure shows unitary current amplitudes (measured by eye) plotted against Vb. The cis bathing solution was the same as that used in A. The trans solution contained either 100 mM CsCl + buffer A (•) or 240 mM glycine + buffer A (○). The decrease in slope conductance (from 155 to 86 pS) and the minimal change in Erev (from +9 to +5 mV) upon replacement of CsCl with glycine confirm that these channels were equally permeable to cations, anions, and glycine, consistent with similar measurements on intact parasites (3). The slope conductances and the Erev values were identical to those measured by patch clamp of intact parasites (3), confirming that this is the same channel. Channel events in CsCl (Left Inset) and glycine (Right Inset) at Vb = −50 mV. Scale, 4 pA/100 ms. (C) Subconductance states. Solid and dashed lines represent closed and fully open states, respectively. The dotted line represents a subconductance level seen previously (3). It is not a separate channel because there are two full transitions (indicated by arrows) that would require the unlikely simultaneous opening and closing of two independent channels. Bath solutions are the same as those in A. Vb = +30 mV.

