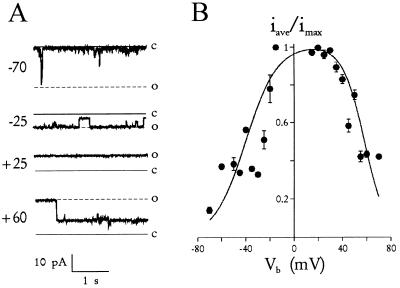
Figure 2.
Voltage dependence of the channel. (A) Typical channel activity at a range of Vb values indicated. The bathing solution on both sides of the bilayer was 160 mM KCl + buffer A. The channel’s closed and fully open states are indicated by solid and dashed lines,respectively, at each voltage. Notice that the channel is mostly open at ±25 mV and less so at −70 and +60 mV. The intermediate level shown in the sweep recorded at +60 mV is a subconductance state. (B) Average normalized current as a function of Vb. At each Vb, recordings from the channel in A were integrated (average of 45 s each) and normalized to the value for a fully open channel. Although different from classical open probability determinations, this calculation incorporates transport during subconductance states and indicates the net flux per unit time. Notice that near Vb = 0, the channel passes ≥96% of its maximal current. The solid line is given by iave/imax = 1.01/{[1 + exp((−40 − Vb)/13)] · [1 + exp((Vb - 58)/9)]}, representing a fit to the product of two Boltzman equations (11).

