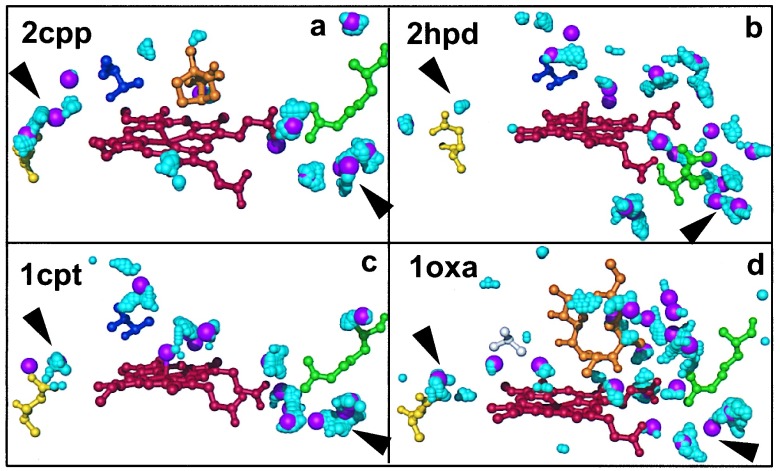
Figure 3.
Structural hydration of the cytochrome P450 crystals. Hydration analysis using crystallographic data and PMF calculations of the regions near the heme propionate–arginine salt bridge and the internal solvent channel. The heme is shown in red, arginine in green, glutamate in yellow, threonine in blue, and alanine (1oxa) in gray. The large magenta spheres indicate crystallographic water positions. The cyan spheres correspond to grid points with high water density in the PMF calculations. Medium and small cyan spheres correlate to densities larger than five, and between three and five, respectively, in units of the bulk density of water. Results are shown for P450cam (a), P450BM3 (b), P450terp (c), and P450eryF (d). An extended water cluster is found near the arginine on the proximal side of the heme plane (lower right corners of a–d, indicated by arrowheads). The internal solvent channel is found in the P450cam (a) and P450eryF (d) structures (upper left corners of a–d, indicated by arrowheads). In P450cam, the solvent channel appears as a continuous high-water density wire in the PMF calculations. In P450eryF, water density regions are strongly localized.

