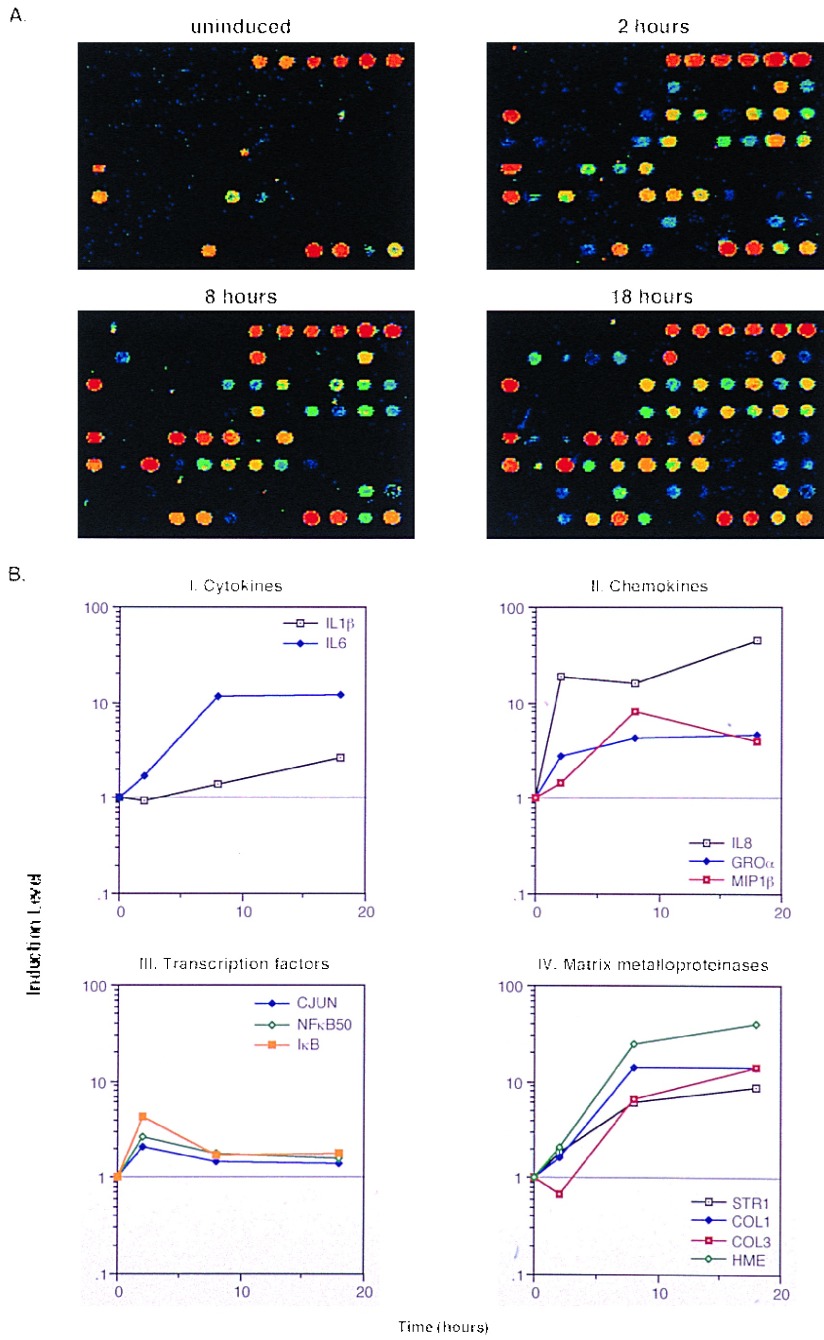
Figure 3.
Time course for IL-1β and TNF-induced SW1353 cells using the inflammation array (Fig. 1). (A) Pseudocolor representation of fluorescent scans correspond to gene expression levels at each time point. (B I–IV) Relative levels of selected genes at different time points compared with time zero.

