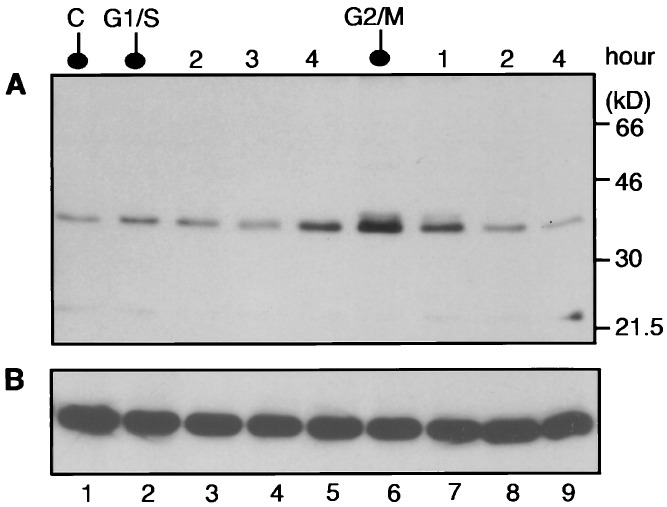
Figure 2.
Phosphorylation of PP-1C during the cell cycle. T cell hybridoma KMls-8.3.5 were synchronized at the G1/S or G2/M boundaries, and arrested cells were released by incubating with fresh medium for the indicated time periods. Equal amounts of protein (20 μg) were resolved by SDS/PAGE (10% acrylamide) and transferred to Immobilon-P. (A) Lysates from asynchronous (lane C), G1/S, G2/M phase cells, or cells released from drug treatment were analyzed by immunoblotting using G-97 antibody (PP-1C, Mr ≈ 37). (B) Total PP-1Cα was measured in the same samples using an anti-PP-1Cα antibody. The stages of the cell cycle were confirmed by fluorescence-activated cell sorter analysis (data not shown). PP-1Cα is present in ≈5-fold higher amounts than PP-1Cα in KMls cells (data not shown). The signal obtained with the G-97 antibody in KMls cells therefore represents predominantly PP-1Cα.

