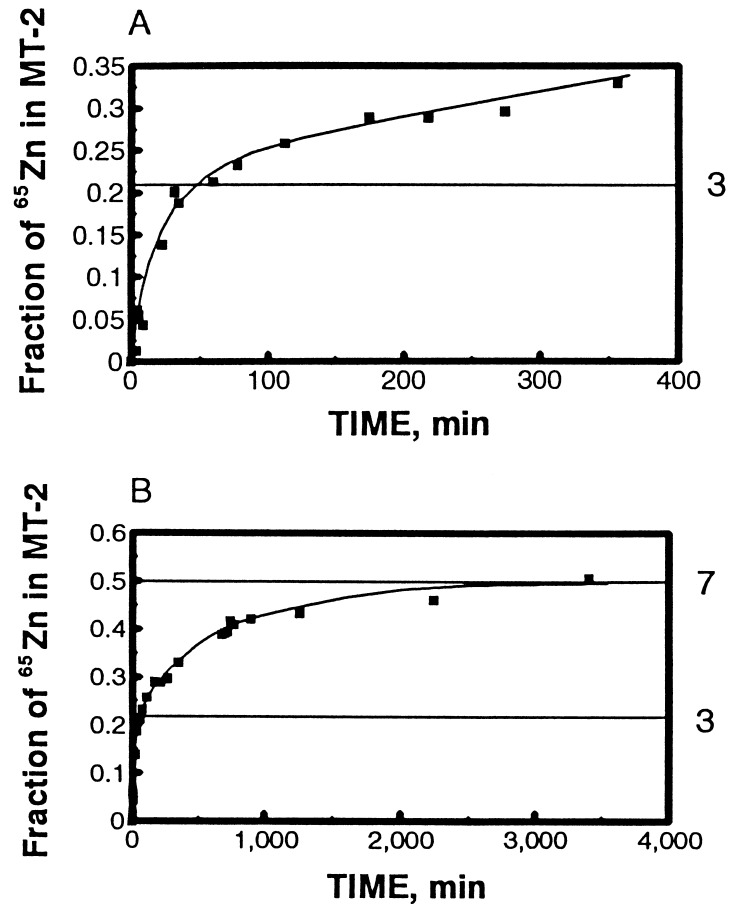
Figure 3.
(A and B) Time course of zinc exchange between 65Zn7-MT-1 and Zn7-MT-2. The horizontal lines represent amplitudes corresponding to the exchange of three and seven zinc atoms, respectively. Conditions are as described in the legend of Fig. 2.

