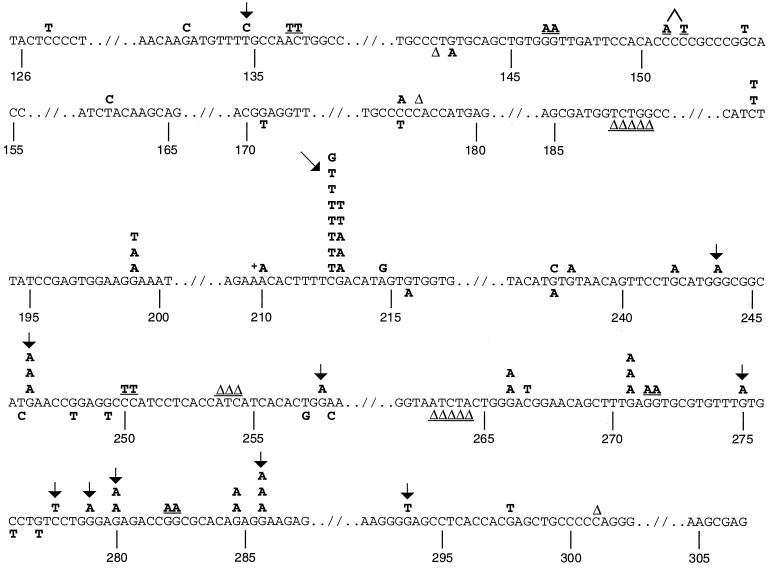
Figure 1.
Distribution of spontaneous and UV-induced (300 J/m2) mutations in exons 5–8 of p53 in pLS76. Spontaneous mutations are listed below the sequence and induced mutations above. Underlined bases are multiple mutations from the same plasmid, and Δ signifies a 1-bp deletion. Arrows point to identical mutations seen in human skin tumors, precancerous lesions, and cell lines (13). Numbers correspond to codons.

