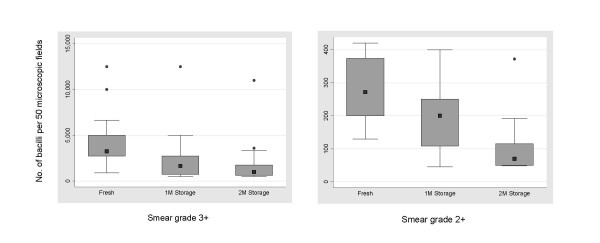
Figure 6.
Effect of storage on bacterial load. Box plots of bacterial numbers per 50 microscopic fields in 3+ and 2+ slides. Boxes show median values and the interquartile ranges, the whiskers denote 2.5th and 97.5th percentiles and the circles indicate the outlier values. 1 M and 2 M refer to 1 month and 2 months of sputum storage at -20°C.

