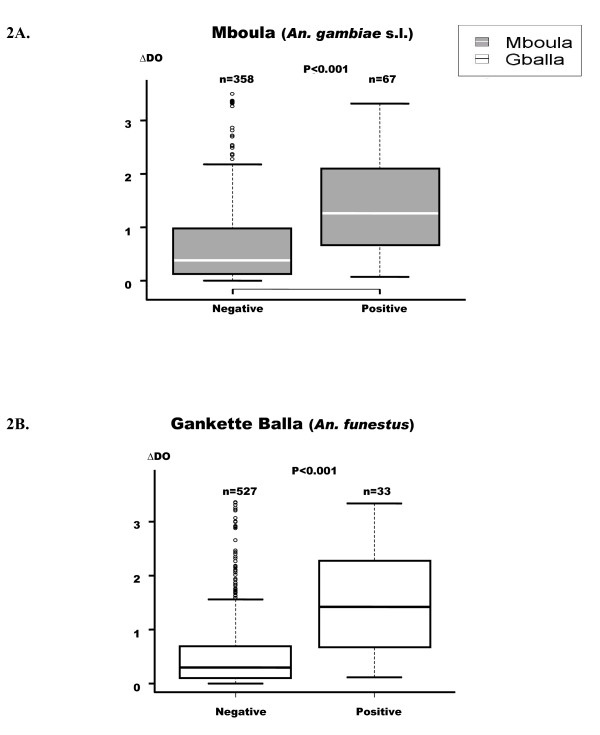
Figure 2.
Anti-P. falciparum IgG responses according to malaria positive or negative infection in both villages. p value of the Mann-Whitney U-test, Box-whiskers plots illustrate medians with 25th and 75th percentiles, and whiskers for 10th and 90th percentiles. The upper whisker extends to the largest value below the 75th percentile plus the box height multiplied by 1.5. n = number of children with or without malaria positive infection.

