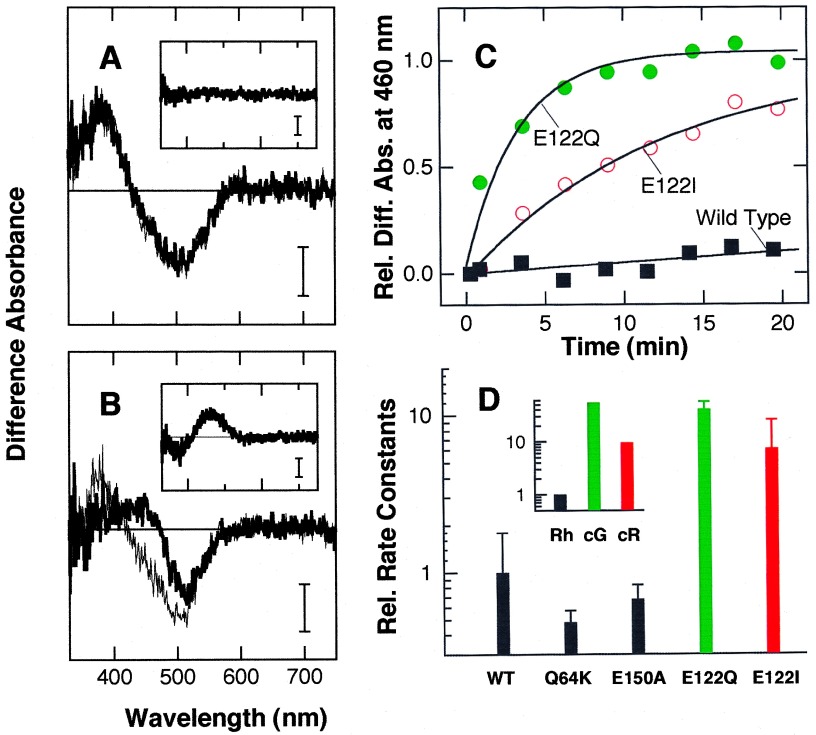
Figure 3.
Thermal reactions of meta II of wild-type and mutant rhodopsin. (A and B) Formation and decay of meta II monitored by change in the absorption spectrum. Wild-type (A) and E122Q (B) rhodopsins were irradiated with orange light for 30 s at 2°C, followed by continuous recording of the absorption spectra. The thin and bold lines in each panel represent the difference spectra obtained by subtracting the spectra before irradiation from those immediately after and 20 min after irradiation, respectively. The spectra shown in the Insets are the difference spectra between thin and bold lines. (Bars = 0.003 absorbance unit.) (C) Course of conversion from meta II to meta III in wild-type, E122Q, and E122I rhodopsins. Increase in absorbance at 460 nm due to the formation of meta III from meta II is plotted as a function of incubation time after the irradiation. Solid curves are the fitted single exponential curves with the time constants of 190 (wild type), 3.3 (E122Q), and 12 (E122I) min, respectively. (D) Rate constants of meta II decay in wild-type and mutant rhodopsins, and native chicken rhodopsin (Rh), chicken green (cG), and chicken red (cR) (Inset). Rate constants of wild-type and native rhodopsins were normalized to 1, and the rate constants of mutant rhodopsins and native cone pigments are represented relative to those of their respective rhodopsins. The standard deviations were estimated from three independent experiments using different preparations.

