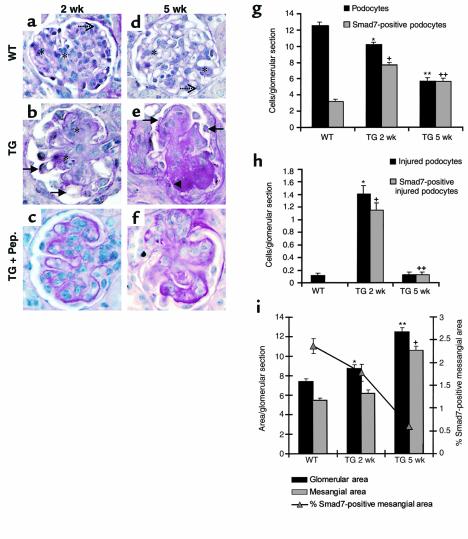
Figure 2.
(a–f) PAS staining and anti-Smad7 immunoperoxidase labeling of renal cortex sections of WT (a and d) and TG mice (b and e) at 2 weeks (TG 2 wk) (a–c) and 5 weeks (TG 5 wk) (d–f) of age. Absence of Smad7 immunoperoxidase labeling in the presence of blocking peptide in 2-week-old (c) and 5-week-old (f) TG mice as control for specificity of staining. Dotted arrows depict Smad7-negative podocytes and stars denote Smad7-positive mesangial areas (a and d). Arrows indicate Smad7-positive podocytes with representative features of damage, including pseudocyst formation and partial or complete detachment from basement membrane (b and e). Arrowhead shows synechiae of basement membrane and Bowman’s capsule (e). (g) Histogram shows average numbers of podocytes (filled bars) and Smad7-positive podocytes (hatched bars) per central glomerular section. Bars represent average ± SEM numbers of cells per glomerular section determined from 180 glomeruli (30 per mouse) in TGF-β1 TG mice at 2 weeks and at 5 weeks of age, respectively, and 240 glomeruli (30 per mouse) in the WT. Results of t test: *Podocyte counts in WT vs. TG 2 wk, P < 0.001; +Smad7-positive podocyte counts in WT vs. TG 2 wk; **podocyte counts in WT vs. TG 5 wk, P < 0.001; ++Smad7-positive podocyte counts in WT vs. TG 5 wk, P < 0.001. (h) Histogram shows numbers of podocytes with criteria of injury (filled bars) and Smad7-positive injured podocytes (hatched bars). Annotations are as described in g. (i) Histogram shows glomerular surface area (filled bars) and mesangial surface area (hatched bars) per glomerular section in arbitrary units (annotations as in g). Line graph indicates ratio of Smad7-positive mesangial area to total mesangial area (see Methods for definitions).

